
EMA, or exponential moving average, is a type of moving average that places more weight on recent prices to make it more responsive to new information. It’s a popular technical indicator used by traders to identify trends, as well as potential buy and sell signals. What is EMA? How to use EMA indicator in 2023:
It is calculated by adding a certain percentage of the current price to the previous EMA. This percentage is known as the smoothing factor. In this article, we will discuss what EMA is, how to use it in your trading, and what are the benefits and drawbacks of this indicator.
What is Exponential Moving Average (EMA)?

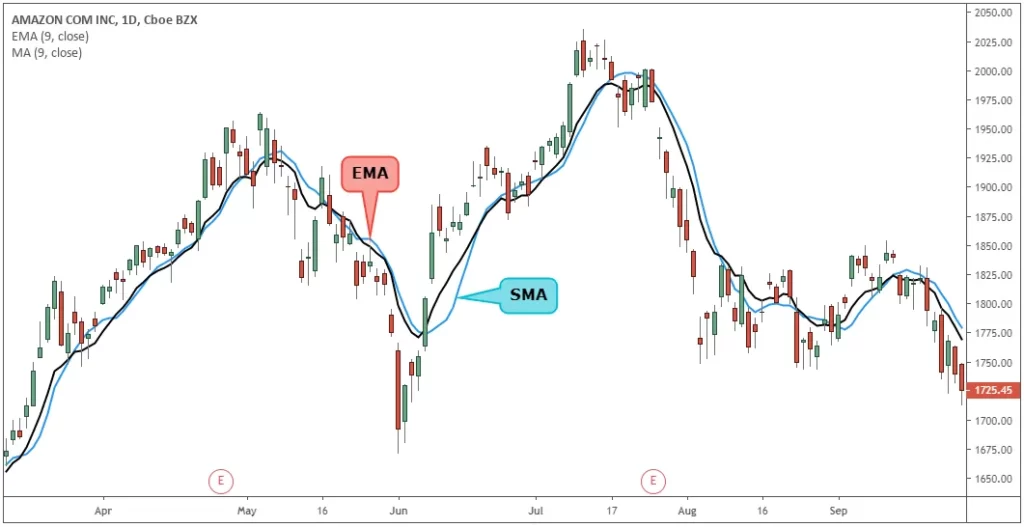
The exponential moving average (EMA) is a type of moving average that places a greater weight and importance on the most recent data points. This makes it more responsive to recent price changes than a simple moving average (SMA), which applies an equal weight to all data points in the period. The EMA indicator is used in technical analysis to smooth out short-term price fluctuations and highlight longer-term trends.
An exponential moving average is calculated by applying a percentage of the current closing price to the previous period’s EMA value. This percentage, known as the smoothing factor, can be anywhere between 1% and 50%.
The formula for calculating an EMA is:
EMA = {Current Closing Price – EMA (previous period)} x multiplier + EMA (previous period)
where the multiplier is:
2 / (Number of days + 1)
How to use EMA with Formula

If you are new to technical analysis or just want to learn more about the EMA indicator, this article is for you. We will cover everything you need to know about the EMA indicator, including what it is, how to use it, and what settings to use.
The EMA indicator is a moving average that places more weight on recent prices. This makes it a more responsive moving average than the simple moving average (SMA). The EMA formula is:
EMA = Price(t) * k + EMA(y-1) * (1 – k)
where:
t = today’s price
y = yesterday’s EMA
k = 2/(n+1), where n is the number of days in the EMA period
For example, a 10-day EMA would have a k value of 2/(10+1) = 0.1818. A 20-day EMA would have a k value of 2/(20+1) = 0.0952. And so on… So, what does all this mean?
The Different Types of EMA
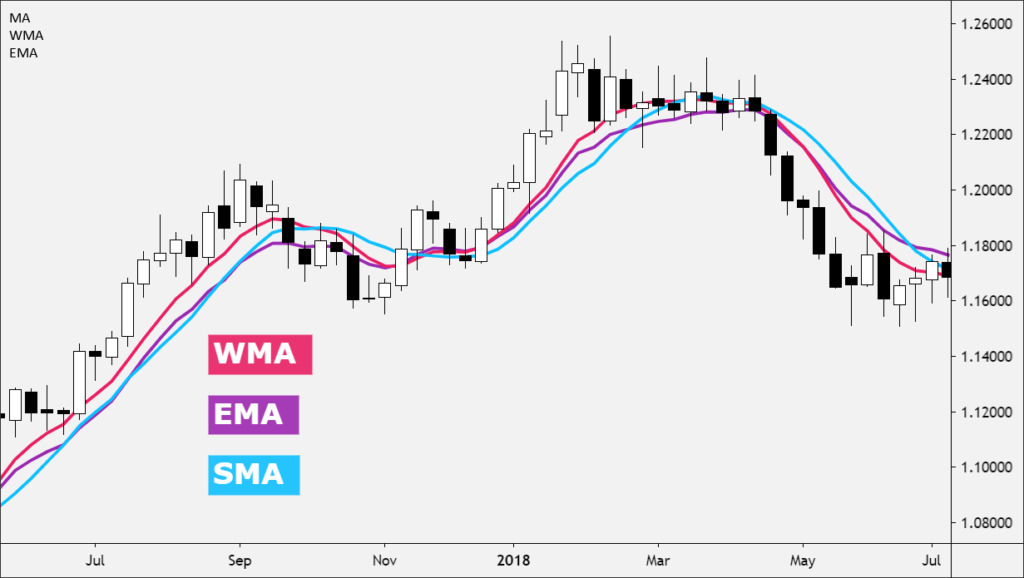
There are three different types of exponential moving averages:
The first type is the simple exponential moving average (SMA), which is the most common type. It is calculated by adding the closing price of each period and dividing by the number of periods.
The second type is the weighted exponential moving average (WMA), which gives more weight to recent data. It is calculated by adding the closing price of each period and multiplying it by a weighting factor, then dividing by the sum of the weighting factor.
The third type is the double exponential moving average (DEMA), which smooths out the data even more than the WMA. It is calculated by adding the closing price of each period and multiplying it by two, then subtracting the SMA from this sum.
Pros and Cons of EMA

There are pros and cons to using the EMA indicator. Some argue that the EMA is faster than the SMA, while others argue that it lags behind price action.
The main benefit of using the EMA is that it reduces the amount of lag that is present with the SMA. This means that traders can get into trades sooner and potentially make more money.
However, some argue that the EMA actually lags behind price action. This means that by the time a trader enters a trade, the market may have already moved on. As such, traders need to be aware of this potential downside before using this indicator.
What does EMA tell us?
The exponential moving average (EMA) is a technical indicator that shows the average price of a security over a set period of time. The EMA is calculated by adding the closing price of the security to a multiplicative weighting factor. The weighting factor is equal to 2/(1+N), where N is the number of days in the period.
The EMA is used as a trend following indicator and can be used to identify support and resistance levels. The EMA can also be used to generate buy and sell signals. A buy signal is generated when the EMA crosses above the price, and a sell signal is generated when the EMA crosses below the price.
The most common time periods for EMAs are 12-day, 26-day, and 50-day EMAs.
How to take trade with EMA

If you are looking to trade with the EMA indicator, there are a few things that you need to know. The first is that the EMA works best on longer time frames, such as the 4-hour or daily chart. This is because the indicator is designed to smooth out price action and filter out noise.
The second thing you need to know is how to properly interpret the EMA. The indicator itself is very simple – it is just a moving average. However, there are a few ways to interpret it.
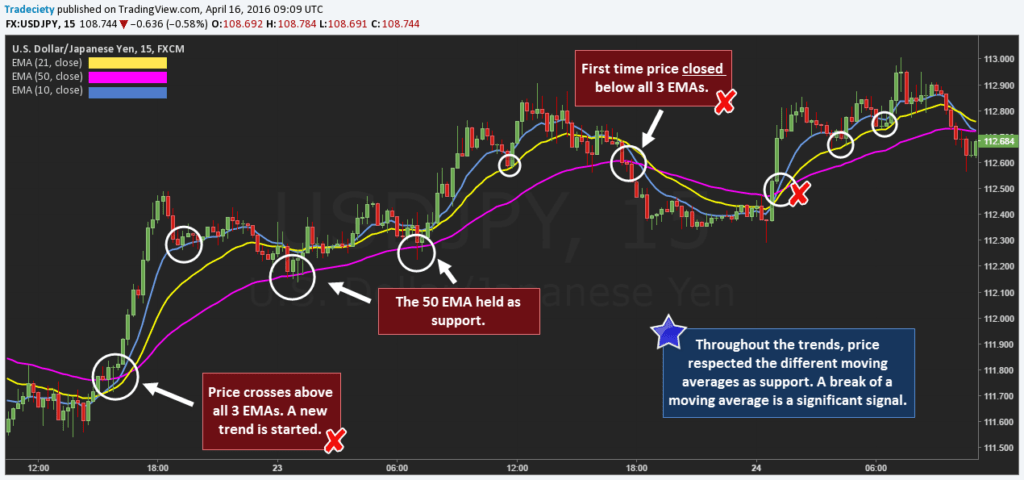
One way is to use the EMA as a trend filter. In other words, you would only take trades in the direction of the EMA. So, if the EMA is pointing up, you would only look for long trades; if it is pointing down, you would only look for short trades.
Another way to use the EMA is as a dynamic support or resistance level. This means that you can use it to enter and exit trades. For example, if price breaks above the EMA, you could enter a long trade; if price then falls back below the EMA, you could exit your trade.
The last thing you need to know about trading with the EMA is that it is important to use other indicators in conjunction with it. For example, many traders will use candlestick patterns or Fibonacci levels in addition to the EMA to confirm trade entries and exits.
How to Use EMA Indicator in TradingView
In this article we will discuss how to set an indicator in tradingview. This is a simple process, you can also learn how to use more advanced indicators.
In TradingView you configure your indicators by adding them to the chart and setting their parameters on the right side of the screen. If there is not a particular parameter that you need, simply leave it at its default value.
After adding an indicator we need to configure it by going into its properties.
—
This article is about setting the EMA indicator on TradingView.
In order to set the EMA indicator, you will need the following information:
1. Symbol of your cryptocurrency (it’s not necessary but it’s helpful)
2. Length of your ema periods
3. The input for the ema period length should be between 10 and 1000
4. Your trading timescale should be between minute and hourly
—
How to Set up an EMA (Exponential Moving Average) indicator on TradingView.

The TradingView platform is a great solution for traders who want to execute trades from all over the world. The platform is also customizable to meet the needs of any trader. Here are some steps on how to set up an EMA (Exponential Moving Average) indicator on TradingView.
First Step: Login and click “sign in”.
Second Step: Click “settings” and then “general settings”, then find “EMA indicator” and click “set it up”.
Third Step: Define your EMA interval, the trigger level, and the sensitivity of your MA curve respectively. You can also take a look at other default settings to get an idea of what they do first before changing them too much.
Fourth Step: Click “save changes” and you will be able to see your EMA indicator displayed on the screen.
—
If you’re looking to get up and running quickly, this tutorial will walk you through the process of setting up your ema indicator on TradingView.
Conclusion
The EMA indicator is a powerful tool that can help you make better trading decisions. By understanding what the EMA is and how to use it, you can give yourself a significant edge in the market. We hope that our guide has helped you learn more about this important indicator and how to apply it in your own trading.
Learn more about: Crypto Hardware Wallet in Ohio