Technical Analysis vs. Fundamental: An Overview
What is technical analysis and fundamental analysis? Technical analysis, also called charting, looks at the price movement of a security in order to predict future price movements. Traders who are looking for trends typically use this type of analysis. Fundamental analysis looks upon fundamentals as the basis for pricing security.
The difference between these two is one approach, but not their underlying principles.
Technical analysis and fundamental analysis are two forms of analysis used by traders looking to trade stock options. To understand whether the technical or fundamental analysis is best for your trading needs, it’s helpful to know what these methods are and each method’s strengths and weaknesses.
Investors can use both fundamental and technical analysis independently or together to forecast future movements in the price of Gold, Silver, Oil and other commodities.
Method’s strengths and weaknesses
The fundamental analysis employs different techniques for longer time spans, such as looking at corporate earnings reports, news about goods sold, and other factors that affect the economy as a whole.
Technical analysis is a method of analyzing the price action based on past price movements and sometimes taking into consideration new developments such as news. Fundamental analysis, on the other hand, looks at a security’s fundamentals — like earnings and revenue — to determine whether or not to purchase it or not.
A stock is analyzed from a fundamental perspective by taking all of these factors into consideration.
Stocks are evaluated by measuring their intrinsic value through fundamental analysis. Companies’ financial strength and management are taken into account by fundamental analysts along with the overall economy and industry conditions.
Beginner’s guide – Fundamental vs. technical analysis with pros and cons

What is Fundamental Analysis?
Fundamental analysis is the study of security prices, trying to find value in stocks based on economic and industry conditions. The basic idea behind fundamental analysis is to assess the worthiness of a company by examining its financial strength, current performance trends, and future business prospects.
By analyzing a company’s investment potential using market analysis, fundamental analysis can determine the fundamental value of the company.FA is based on the notion that an individual stock is not the only component of a marketplace.
There are over 4,000 companies listed on major U.S. exchanges, so trying to determine if all the stocks in an index have identical values would be near impossible. The theory behind fundamental analysis is that you can take a large group of companies and find those which have recurring or predictable trends in earnings, expenses, assets, and liabilities.
This method is based on comprehensive financial data and includes scrutinizing the economics and morals of a given business.

The fundamentals are the underpinnings of the financial status of a given entity.
The first step in fundamental analysis is to analyze the facts about an underlying company.
Market capitalization
You do this by looking at things such as earnings per share (EPS), revenue, or other financial variables. Another way to evaluate a stock based on multiple data points is to determine its market cap or value per share. It is also possible to calculate market cap and value per share using multiple data points, such as earnings per share and cash flow from operations.
Other factors that influence fundamental analysis include industry trends, demographics, and economic factors affecting earnings potential as well as debt load versus assets for comparison with peers in similar industries or products.
Good fundamental analysis is the best tool a trader or investor can use. It allows you to figure out what a stock is worth, based on intrinsic factors and not on sentiment.
There are no shortcuts here—what matters is whether you have the ability to do due diligence yourself and the determination to study companies’ financial records.
What is Technical Analysis?
Technical analysis is a trading method based on chart studying and stock charting. Technical analysis traders do not use fundamental analysis. Rather, they base their trades on technical analysis at the price levels of stocks, bonds, and commodities.
Technical analysts look at charts to examine a security’s patterns and trends. They try to identify repeating patterns that suggest what security will do in the future.
Technical analysis is a method of investing that uses charts, indicators, and other tools to predict the direction of a security’s price, rather than attempting to determine a security’s intrinsic value.

The fundamental analysis of a stock is evaluating each of its assets and liabilities at market value (its price as determined by supply and demand) to see whether it is worthwhile investing in.
If a company has a high growth outlook or good prospects for earning profit and making money over a period of time, this means that the company has what it takes to be successful with the help of its assets and liabilities.
The fundamental analysis enables investors to make decisions about which companies are worth investing their money in, based on past performance from other companies.
Tools used for fundamental and technical analysis
The fundamental approach’s most important data is the company’s financial statements. Cash flow statements, balance sheets, and income statements are part of these financial statements.
Fundamental analysts focus on the company’s financial position and performance using data from its income statement, balance sheet, and cash flow statements.
This can include seeing if the company is making a profit or losing money. The analysis should also look at how much the company brings in each year to see if the business’s sales are growing or shrinking.

Many people don’t realize how broad technical analysis is. Technical analysts use charts, graphs, and other tools to analyze market developments and predict future price movements.
These analysts refer to price charts – usually either line charts, bar charts, or candlestick charts – as well as any number of technical indicators such as moving averages and oscillators calculated from stock prices.
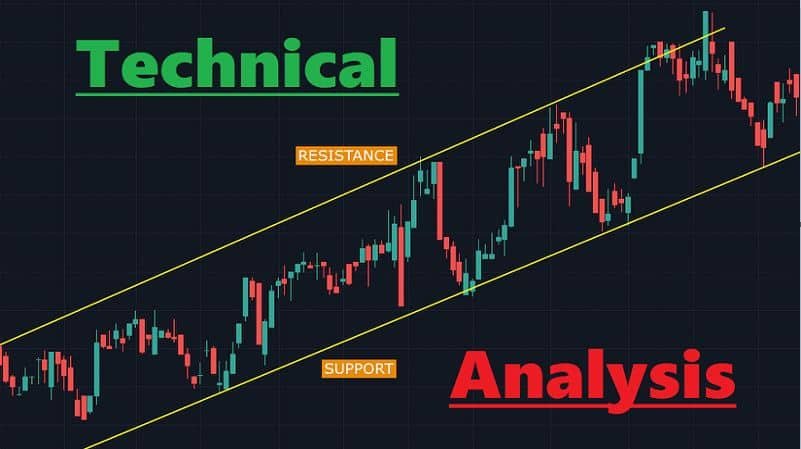
In general, these analysts can use patterns, such as flag formations and retracements in price action, to identify potential trends and measure momentum going into key levels of support or resistance. Price trends and momentum are measured by trend followers using other tools.
Fundamental analysts are primarily concerned with company performance and stock price. They analyze financial statements and use them to analyze the business and market environment. Fundamental analysis is a good way to identify the quality and performance of a company’s operations, products, or services.
Fundamental vs. technical analysis: Which is better?
Traders and market timers are more likely to benefit from technical analysis in the short term. Undervalued or overvalued stocks cannot be determined by charts, however.
Fundamental and Technical Analysis. Both can be used for different purposes, but it is important to key in the purpose of each analysis. Fundamental Analysis is more useful for long-term investments such as stocks and bonds.
Fundamental analysis is based on discounted cash flow models and discounted stock price models. In technical analysis, price charts show only how a stock’s price has changed over time, making it ideal for short-term trading.
Long-term Predicting
Fundamental analysis has value in predicting long-term trends such as economic growth, while technical analysts try to anticipate short-term market events that are both unpredictable and essentially random.

Fundamental analysis is the study of what a stock has done in the past to base an assessment of its value. Technical analysis uses charts and technical indicators to show how other investors are performing and might perform going forward, therefore providing information on where stock prices might be heading.
Fundamental analysis cannot determine whether a stock is under or overvalued, nor does it accurately predict how much a company will increase or decrease in value.
Pros and cons of fundamental analysis
The main pros of fundamental analysis are that it helps you understand the current economic environment, assess economic variables, and make future projections on investor behavior.
On the other hand, fundamental analysis has its share of cons because it’s unable to assess qualitative factors like a company’s growth potential and long-term prospects. Furthermore, it may result in faulty decision-making because oftentimes investors overlook potential negative elements in their companies that could impact their intrinsic value.
Fundamental analysis is a technique that evaluates the health of an equity or bond market. Our fundamental analysts use fundamental data as well as technical analysis to provide actionable analysis.
FOMO (fear of missing out)
Fundamental analysis is the way to add new security to your portfolio. As with any investment, you need to consider the pros and cons before taking a position. Here are four key things to consider when making your decision:
Fundamental analysis is the study of the market in price and volume through technical analysis. Benefits: You can make money by buying a stock below its intrinsic value (realizable profit).
If the market has been going down for a long time then it’s a good time to buy.
Cons: When you are trading stocks you need to make sure that your money is safe because sometimes you can end up losing all your hard-earned money if there is no proper research or even if you trade on emotions alone i.e. FOMO (fear of missing out).
Pros and cons of technical analysis
Technical analysis is a trading technique that uses chart patterns as a guide to forecasting changes in market prices. The downside of technical analysis is that it can be very subjective, making it difficult for non-experts to predict price movements.
As a result, the technical analysis offers traders the chance to profit by following or breaking trends in the market when the time is right.
This is distinct from fundamental analysis which looks at the fundamentals of an asset class (such as earnings, dividends or supply-and-demand factors) or an entire economy to try and determine its future direction.”
Technical analysis is the use of charts and charts to determine the most viable way to trade a particular asset. A number of traders use technical analysis as a method as part of their talent set, while others are more interested in it as a short-term means of making profits.

Technical analysis takes a mathematical approach to predict future prices. Technical analysts believe it is possible to identify where investment will end up trading; that is, you can tell what price option traders think a stock will be when it opens on the NYSE.
However, technical analysis does not explain why these price points exist and only tends to be successful if you follow the trends noted by an expert analyst who has spent many years studying markets.
Technical analysis is not the only way to make money in the markets. It is just one way, and it’s important to keep in mind that everyone who has ever made money in the markets started out by using some kind of strategy.
Using fundamental and technical analysis together
- It is common to combine fundamental analysis with technical analysis. Fundamental analysis is the study of the company’s financial statements, whereas technical analysis is the study of price patterns.
- When growth stocks are in an uptrend, technical analysis can help identify favorable entry levels. Companies that have high growth rates and trade on high valuations often experience large corrections. In such cases, technical analysis can be used to identify oversold levels.
- Technical analysis is a tool that can be used to identify trends and entry points. When you’re shorting stocks with strong technical, it’s important to know how to manage your risk.
- In a professional tone: Technical analysis is a way of determining the direction of stock by examining historical price data. The most common method is to look at moving averages and other indicators.
- Technical traders use charts and indicators to determine trading opportunities. They may also employ other techniques such as fundamental analysis or charting patterns to help them decide when they should enter a trade or exit one.
- You can also use technical analysis to check whether the fundamentals of a company are sound, based on key ratios such as earnings per share (EPS) and return on equity (ROE). This will give you an indication of future profitability and how much risk you should be taking with your portfolio.
Simple Moving Averages
Simple moving averages (SMA) are an integral part of technical analysis. They are price momentum indicators that help assess trends by averaging the daily price over a fixed time period.
Simple moving averages are an indicator that helps assess the stock’s trend by averaging the daily price over a fixed time period.
Support and resistance utilize price history, while trend lines are similar to support and resistance, as they provide defined entry and exit points with projected past trends.
Support and resistance are keys to trading. We can look at historical data to see if a stock price has been in a certain area. When we find these areas, we can issue buy or sell signals. Support and resistance are also used in trend lines, which are based on how the stock price has moved in the past.
Conclusion
When it comes to unlisted companies, fundamental analysis is all you have available to work with. But, when it comes to listed stocks, there is a lot that can be learned from their trading history. And so does technical analysis have value? The debate over which style of analysis has more value for long-term investors will probably not be resolved for some time.
The debate over the value or usefulness of technical analysis and fundamental analysis has been taking place for at least several decades.
While there are many things to say about both sides, we do believe that value investors who focus on understanding a company’s historical performance can be as successful as fundamental analysts.
Fundamental analysis is the process of evaluating a company’s activities and financial statements to determine if it passes the “value test” or not. In many cases, this requires digging deep into the financial information in order to determine if a company is worth choosing over another.
Technical analysis is the art of reading charts to predict the direction and future price movements of the underlying security. While fundamental analysis focuses on the business model and financial strength of a company before deciding to invest, technical analysis focuses on the past price movements of the underlying security. The two methods are useful in different situations but they don’t always work together.
Learn More About: Cryptocurrency to Cash


